


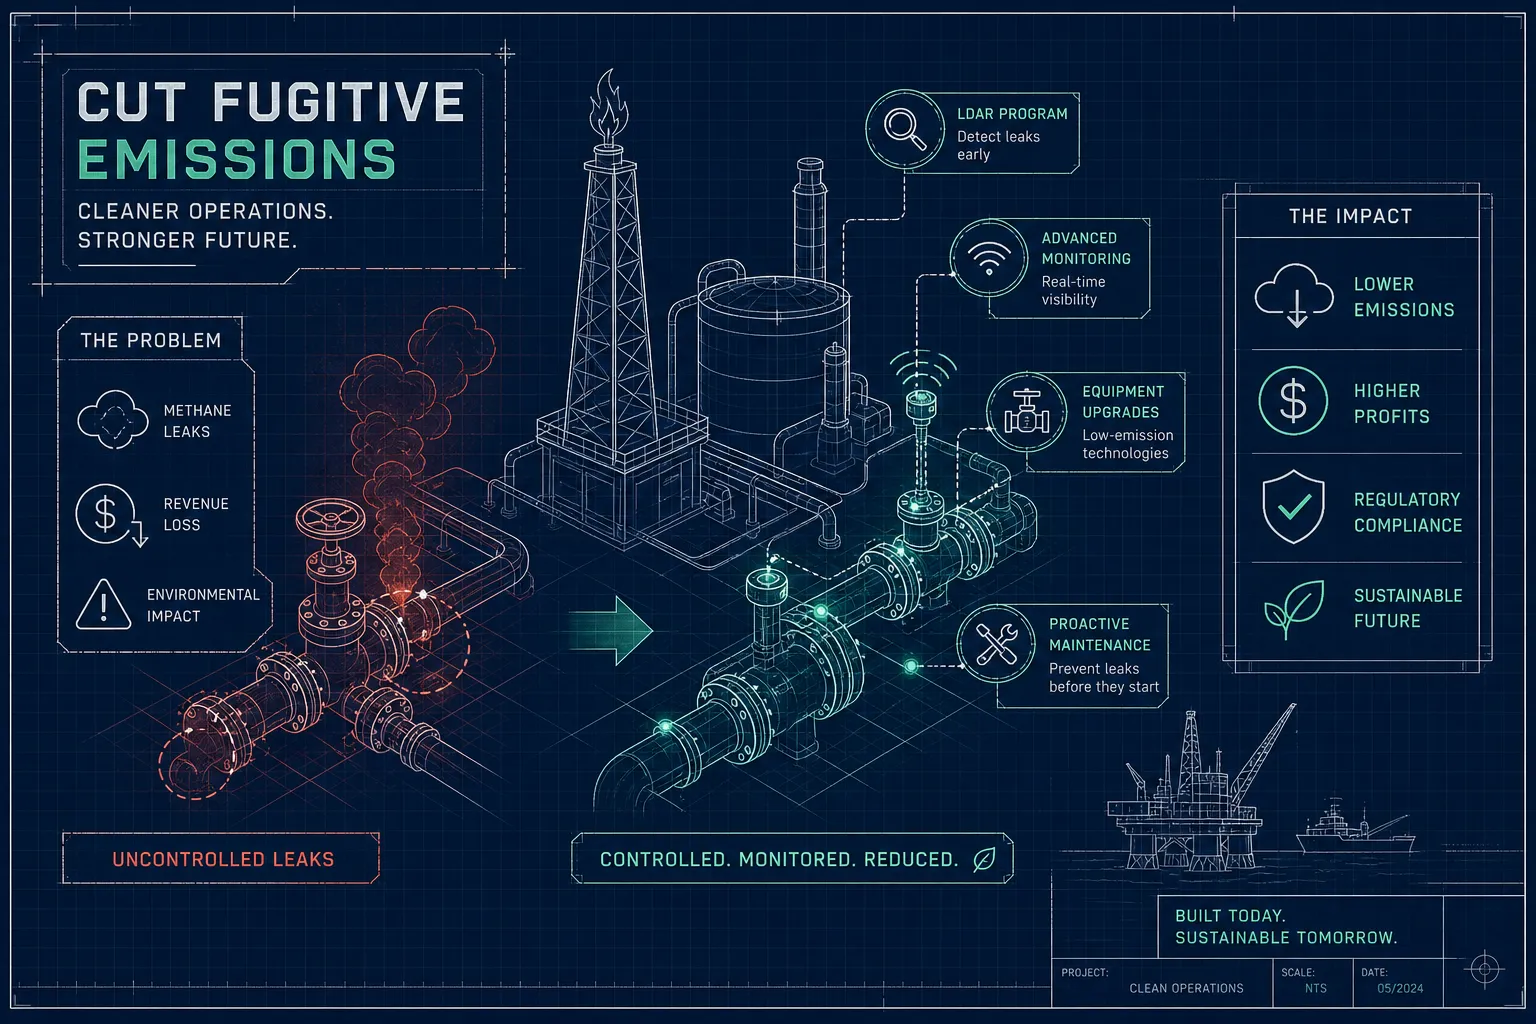
Fugitive emissions from equipment leaks in oil and gas facilities drain product, raise worker exposure, and trigger regulatory actions, often without anyone noticing until the losses stack up. This leak detection and repair in oil and gas guide lays out how a structured program finds invisible losses quickly, fixes them, and documents the result. Done well, many operators find it a cost-effective way to protect asset integrity and the bottom line at the same time.
This guide is for upstream, midstream, and downstream teams that want a practical view of what effective LDAR looks like in the field, what it costs in 2026, and how to make it audit-proof. Across the Niger Delta and other African basins, many operators engage accredited partners to run systematic programs; Osten Laboratory Limited provides industrial testing, inspection, and consulting support to align technology, field methods, and reporting.
You will learn how LDAR works day to day, which detection technologies to combine for methane and VOC leaks, how current regulations shape schedules and repair timelines, what ROI to expect by asset class, and the building blocks of a program that survives regulator and investor scrutiny. The goal is simple: give you a blueprint to design or upgrade LDAR so it delivers measurable emission cuts and clear financial returns.
1. What LDAR actually means in oil and gas operations
Leak detection and repair is a structured, regulation-driven process to identify unintentional releases of gases or vapors from pressurized equipment, then repair and document them. These unintentional releases are called fugitive emissions, and they are distinct from permitted stacks, flares, or planned vents. An LDAR program serves environmental compliance and safety at once, since the same leaks that waste product can create hazardous atmospheres and ignition risks. The core outcome is measurable emissions reduction with traceable proof of repair.
A typical program covers countless small components that add up to big totals. Valves are repeatedly shown to be the dominant source of uncontrolled leaks at many facilities, followed by flanges and connectors, then compressor and pump seals. That breakdown should drive how you schedule inspections and prioritize work orders, because fixing the highest-contributing sources first produces the fastest reductions. Put most early effort where leaks statistically occur most: valves, then connectors. For a practical primer on what typically causes fugitive emissions at oil and gas facilities, see the industry overview on common causes and failure modes.
Most scopes include the following equipment types and interfaces:
- Valves, including control and block valves with stem packing
- Flanges and connectors, including threaded fittings and unions
- Compressor seals and pump seals on rotating equipment
- Pressure relief valves and open-ended lines
- Sampling connections and drain or purge points
2. How LDAR detection technologies work in the field
Leak detection and repair in oil and gas, technologies overview
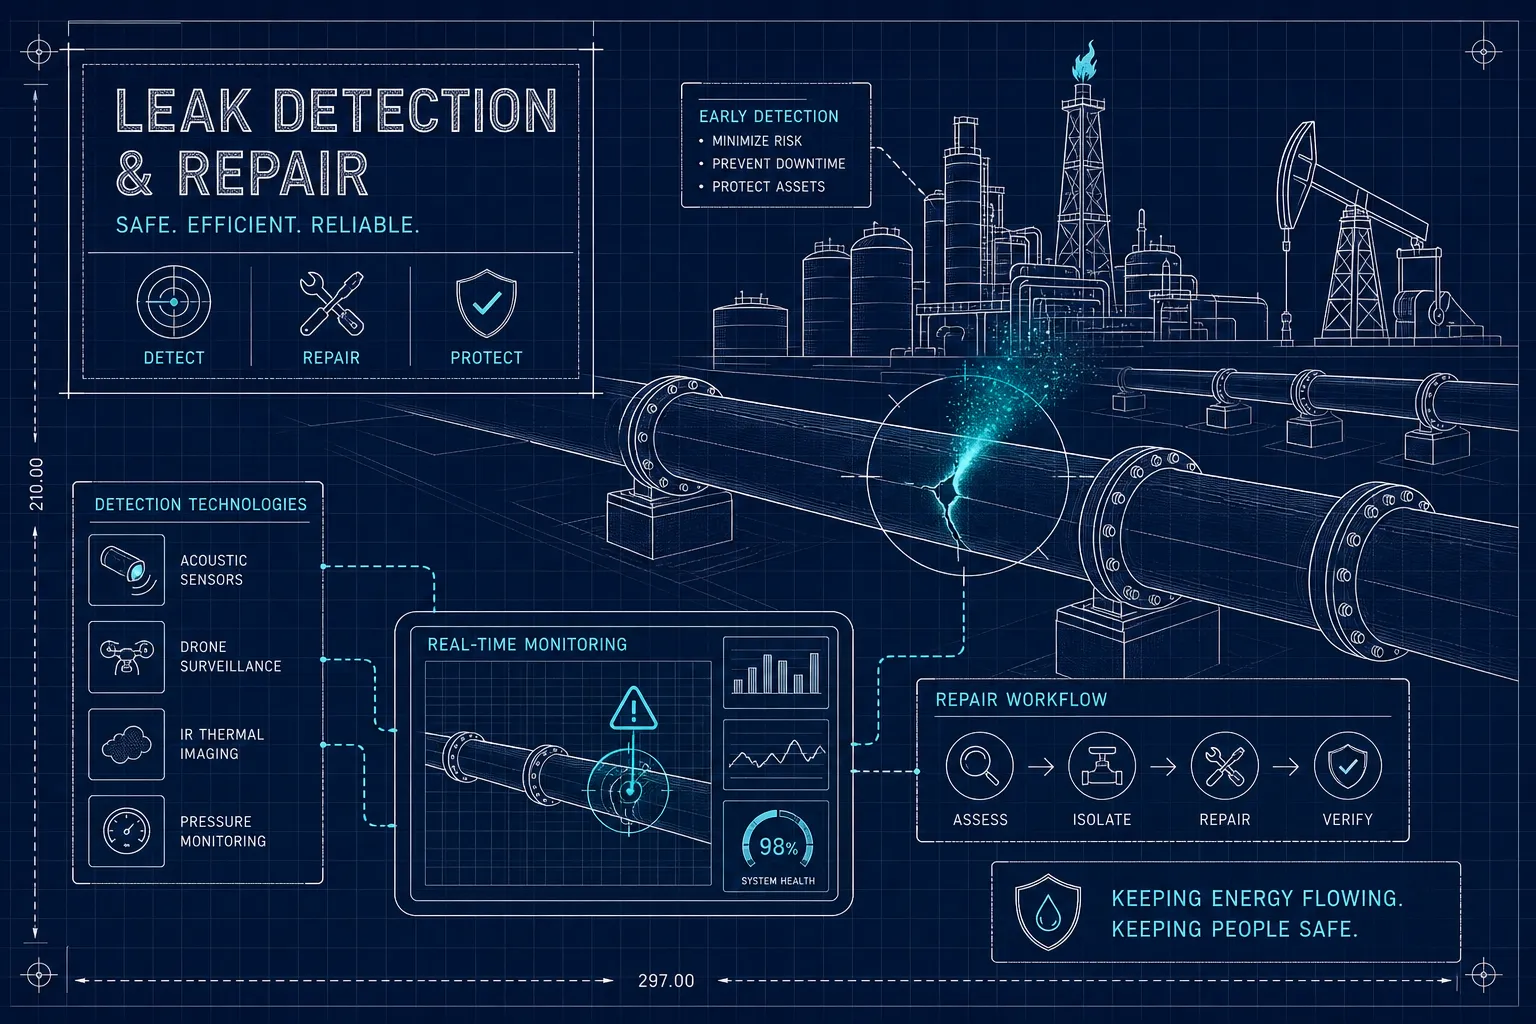
Optical gas imaging (OGI) using infrared cameras is widely used for regulatory inspections and is referenced in U.S. EPA oil and gas rules and guidance. A trained technician moves through the facility and visualizes gas plumes that are invisible to the naked eye, confirming leak sources component by component. Under controlled conditions, methane sensitivity can be on the order of 20 g CH₄ per hour at about 6 meters; real-world performance depends on distance, wind, and temperature contrast. Hardware typically costs $25,000, $120,000, and operator skill is a major driver of success. OGI’s strength is providing visual confirmation, which speeds decision-making and repair. See resources from the U.S. EPA and industry for method details and performance ranges: EPA OGI overview, EPA Method 21. For a practical comparison of optical gas imaging versus traditional leak detection methods, review an industry comparison of OGI approaches and their trade-offs.
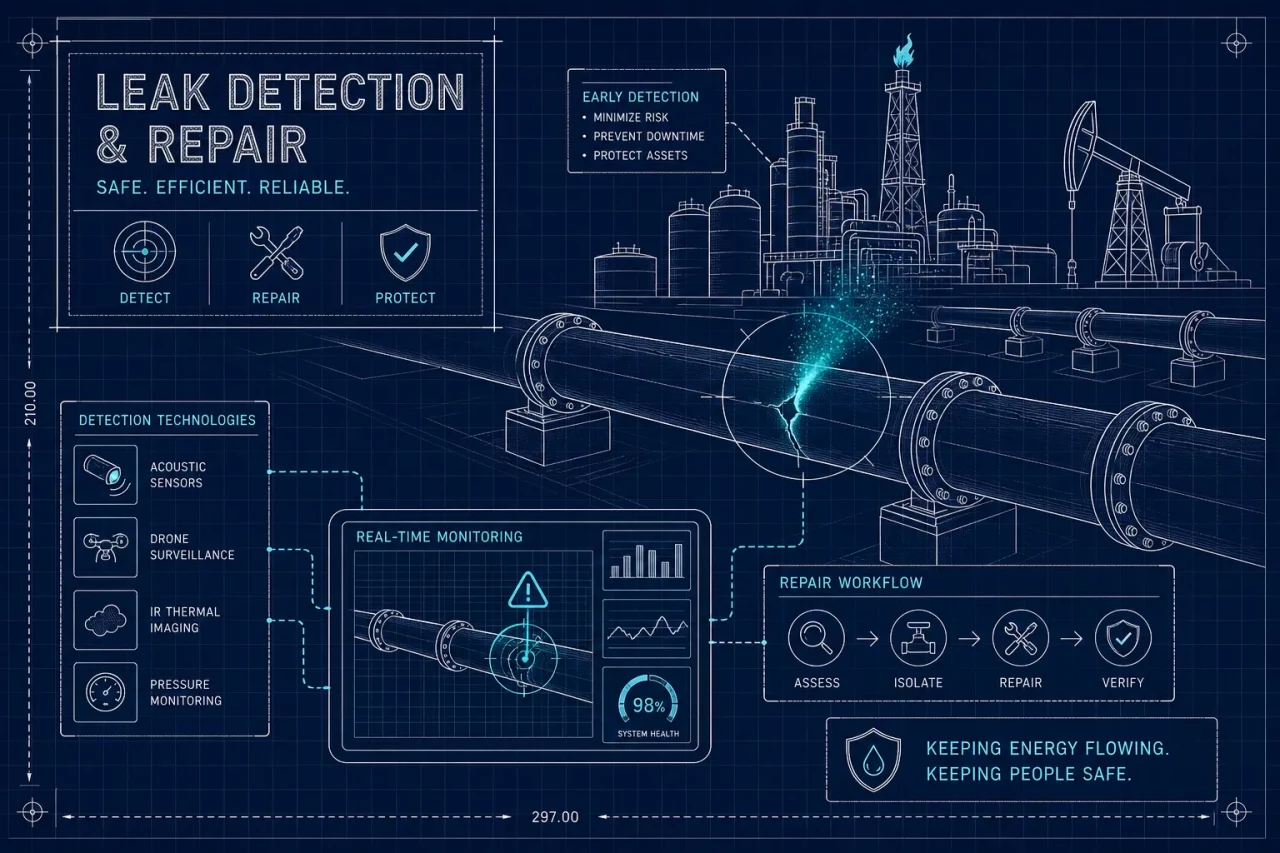
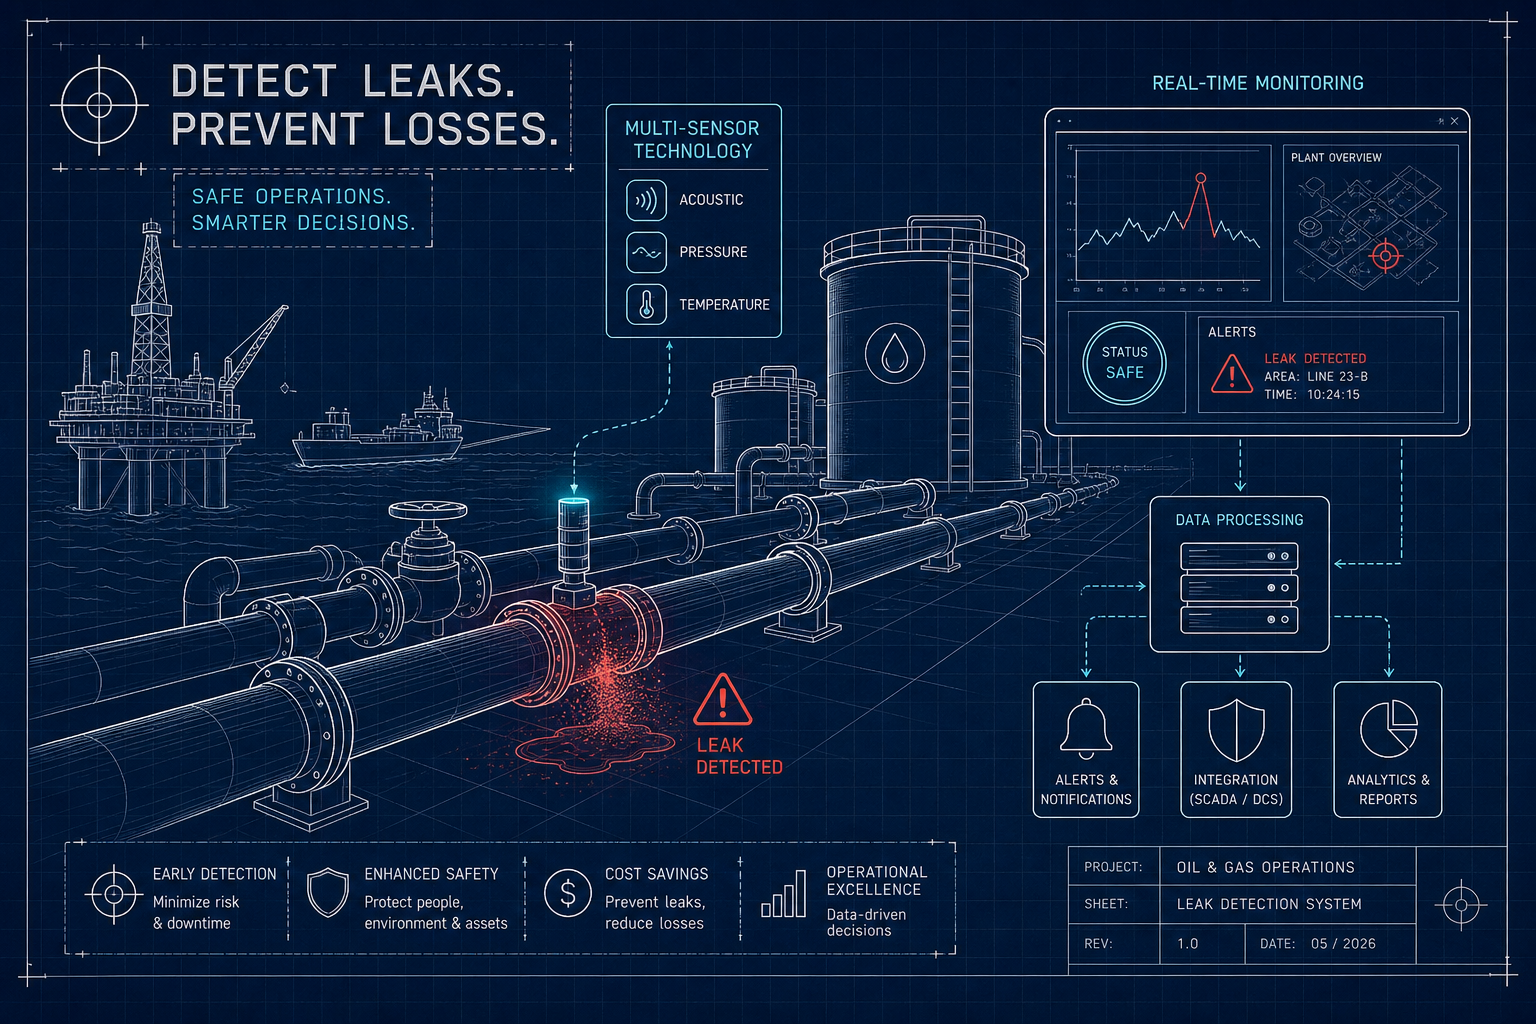
Acoustic leak detection listens for the ultrasonic signature of pressurized gas escaping through an orifice. It is effective for larger leaks and for certain pipeline leak detection tasks, since it focuses on the sound of turbulence rather than gas concentration. The practical limitation is noise: compressor stations and process units generate background sound that can overwhelm sensors and create false alarms. Used alongside OGI, acoustic tools help triage bigger leaks and monitor quieter segments with fewer nuisance triggers. A technology overview of industrial gas leak detection methods can help teams decide which tool fits each leak profile.
Continuous emissions monitoring systems and sensor networks are growing quickly for high-activity assets. Permanently installed sensors flag anomalies between periodic surveys, so you do not wait weeks to find a leak that started yesterday. Over time, continuous monitoring can yield the lowest cost per leak found on busy sites, and newer analytics use machine learning to lower false positives. OGMP 2.0 guidance is pushing operators toward site-level quantification, which continuous systems make far more practical (OGMP 2.0). For guidance on aligning LDAR practice with OGMP 2.0 expectations, see a practical note on LDAR adjustments for OGMP 2.0 implementation.
Integrity tools can also play a role even if they sit outside formal LDAR rules. Pipeline leak detection benefits from pressure transient analysis and distributed acoustic sensing, while pipeline pigging and inline inspection identify corrosion and cracks that cause leaks in the first place. Pair facility-based LDAR with pipeline integrity monitoring to close the loop from leak prevention to rapid detection.
3. The regulatory framework driving LDAR compliance in 2026
Leak detection and repair in oil and gas, regulatory timelines and scope
The 2026 picture combines federal baselines with state or international layers. In the United States, EPA methane standards for oil and gas require scheduled inspections using approved methods such as OGI or EPA Method 21, timely repairs, and detailed records (see EPA’s comprehensive oil and gas rule page: EPA oil and gas rule). Many rules specify an initial repair attempt within 5 calendar days and final repair within 15 days, with documentation of re-inspection. California requires frequent surveys and annual reporting under its methane rule (CARB Oil & Gas Methane), while Colorado’s Regulation Number 7 includes semiannual or monthly checks in some contexts and targets 98 percent waste gas capture by the end of 2026 (CDPHE Reg 7). EPA revisions finalized in April 2026 adjusted certain flare and net heating value provisions and delayed some LDAR elements by three months, yet the core framework remained.
Internationally, best practice is shifting from factor-based inventories to measurement-based reporting. OGMP 2.0 moves companies up a maturity ladder toward site-level methane quantification, with continuous or high-frequency monitoring expected for higher-risk assets. That expectation is also appearing in EU supply chain requirements, which means exporters to Europe face rising pressure to quantify, not just estimate. For a focused read on exact compliance expectations for petroleum facilities, review our guidance on LDAR compliance requirements for petroleum facilities.
In Nigeria, regulators have issued rules and guidance aimed at reducing routine flaring and venting, and compliance programs increasingly include fugitive emissions controls. Operators should review applicable NUPRC guidance and the Flare Gas (Prevention of Waste and Pollution) Regulations and align their environmental management systems accordingly (NUPRC). Facilities that operate without a documented program risk penalties, emissions-related fees, and tighter scrutiny from lenders and equity partners who embed ESG criteria into financing. Having a verifiable LDAR program protects permits and capital access as much as it protects the environment.
Non-compliance has hard and soft costs. You pay in enforcement actions and emissions fees, but you also lose saleable gas, invite safety incidents, and strain your social license to operate with local communities. An effective program is not a sunk cost, it is risk insurance that often pays for itself through recovered product and avoided downtime.
4. The business case: costs, ROI, and what recovered gas is worth
Quick ROI calculation for leak detection and repair in oil and gas
Program budgets depend on asset count and detection choices, but regulator analyses and industry benchmarks are useful guideposts. Inspection costs can range from about $29, $600 per site depending on frequency, method, and contractor experience. Setup adds equipment, software, and training; a compliant OGI camera alone can cost $25,000, $120,000. Repair labor varies with leak access and count, and midstream compressor stations and gas plants tend to yield the strongest financial returns because leak volumes and gas values are higher. For background on abatement costs and economics, see the IEA Methane Tracker (IEA) and EPA LDAR resources (EPA LDAR).
By asset class, the economics split cleanly. Upstream well sites have lower per-site costs, but payback depends on leak prevalence and the value of recovered methane. Midstream gas-handling facilities frequently show negative abatement costs, meaning the program produces net savings through recovered product. Downstream refining and petrochemical units justify programs through VOC and HAP control, compliance assurance, and product loss prevention; EPA guidance indicates refinery LDAR can cut equipment leak emissions by roughly 60% or more.
Emission reductions after repairs can exceed 90% for identified sources, especially when follow-up verification confirms the fix. The financial side is straightforward: estimate methane or product recovery, multiply by price, then subtract program and repair costs. Even where direct gas recovery is modest, avoided penalties, smoother audits, and safer operations round out the return. Continuous monitoring shortens time-to-detect, which raises annual recovery and boosts ROI.
Quick example (illustrative):
- Detected leaks equal an estimated 40 standard cubic meters per hour of methane across a midstream site (≈1,412 scfh).
- At $3.50 per MMBtu and ~1,000 Btu/scf, recovered value is ≈$4.94/hour, or ~$43,300/year if continuous.
- Annualized program cost: $80,000 (surveys, camera amortization, data system, and repairs).
- If repairs eliminate 70% of the leak volume with verification, recovered value ≈$30,300/year; net cost ≈$49,700/year before avoided penalties and downtime. At higher gas prices or higher baseline leaks, payback accelerates.
If you want a fast reality check, sample a subset of assets with OGI and quantify a week of leaks using standard conversion factors or on-site measurement. Combine that snapshot with maintenance data to model repair time and recurrence. With a defensible baseline, you can right-size survey frequency and decide where continuous sensors will beat periodic rounds on cost per leak found.
5. Building an LDAR program that holds up under scrutiny
Program design essentials
Strong programs are built, not improvised. Start by defining the equipment inventory and tagging each component, then assign inspection frequency by risk tier and production criticality. Select detection methods to match the asset, OGI often anchors regulatory surveys, acoustic tools help with larger pressurized sources and some pipelines, and continuous sensors suit high-activity areas like compressors, tanks, and loading racks. Set repair timelines that meet or exceed applicable rules, then close the loop with proof-of-repair and re-inspection. Prioritize fixes for the components that contribute most to emissions at your facilities.
- Build a complete tagged inventory and map it to P&IDs.
- Tier assets and components by leak risk and process criticality.
- Choose detection methods per tier, and define survey routes.
- Set repair SLAs that align with 5-day and 15-day deadlines.
- Verify repairs and document emissions reductions and dates.
- Trend results and adjust frequency where leaks persist.
Records, traceability, and reporting
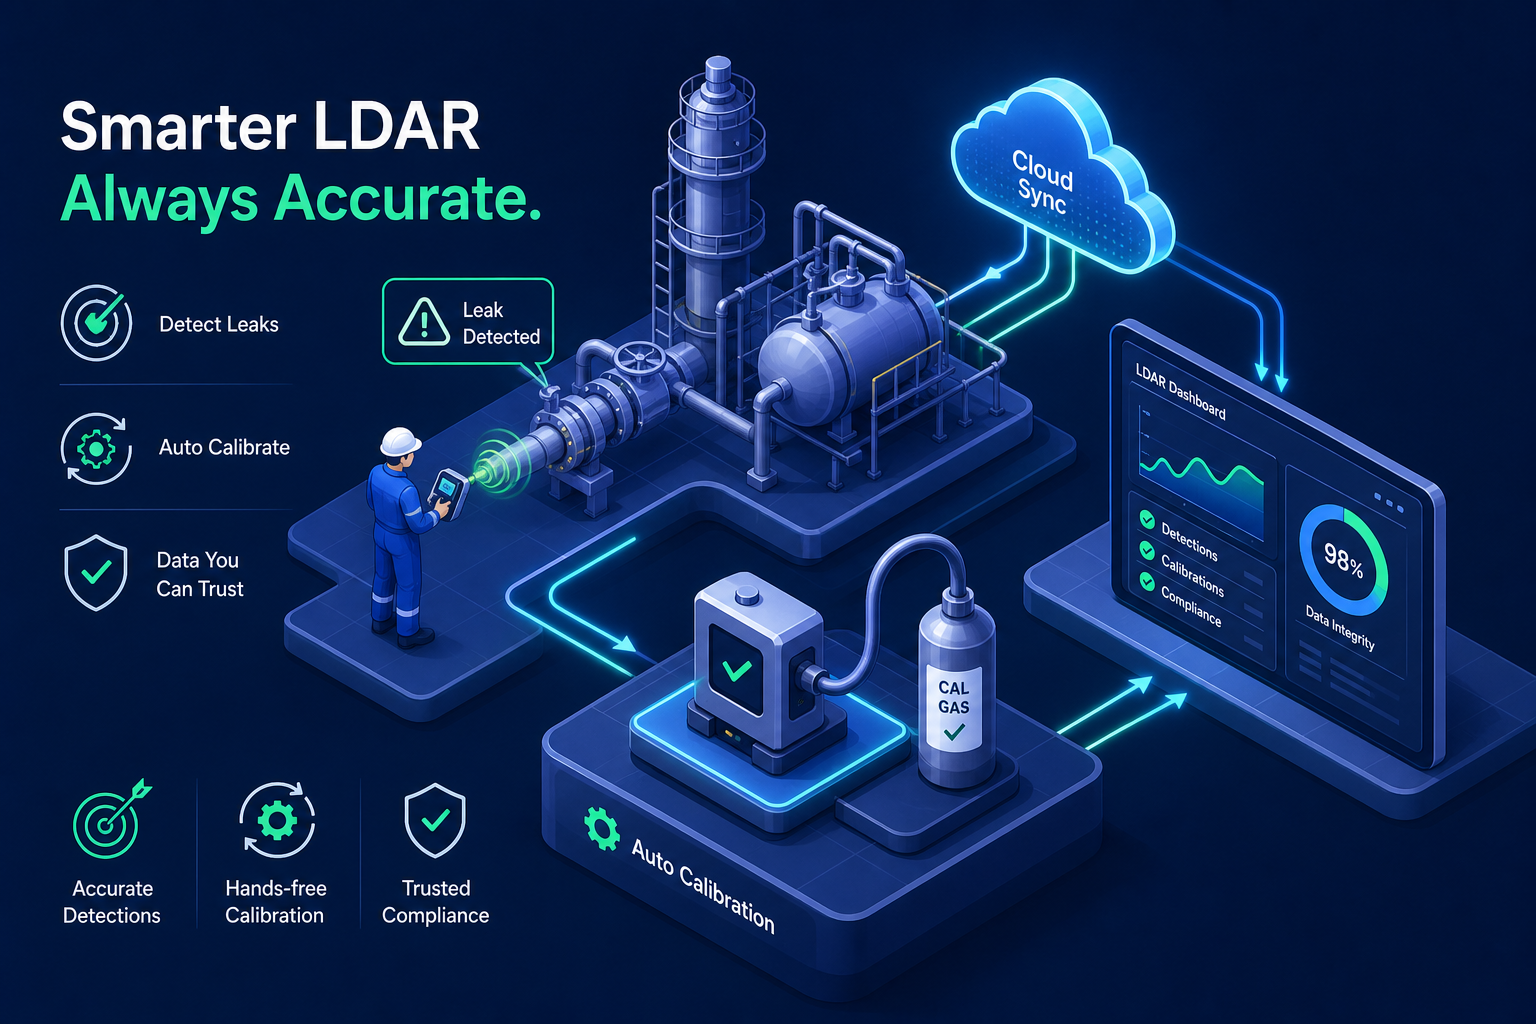
The program is only as strong as its records. Keep inspection logs, leak images or sound files, repair work orders, re-survey confirmations, and emissions calculations in a digital system that survives an audit. Calibrate instruments on schedule and maintain chain of custody for any samples or sensor data used for quantification. ISO/IEC 17025 is an international standard for laboratory competence commonly used to underpin calibration and measurement traceability; aligning with its principles where laboratory support is involved can strengthen your documentation (ISO/IEC 17025). Digital platforms also make OGMP 2.0 reporting more tractable by tying component-level events to site-level methane totals.
Selecting a capable partner
The right partner changes the outcome. Field technicians need to understand wellheads, separators, glycol units, and compressor packages, not just how to point an infrared camera. Quality systems and validated methods lead to reports regulators and investors trust. Osten Laboratory Limited delivers integrated industrial testing, inspection, and consulting services that support LDAR fieldwork and audit-ready reporting. If you want findings that stand up to NUPRC- and EPA-style reviews or investor due diligence, choose a team with documented quality controls and deep oil and gas context. Explore our LDAR services page to see how we can help.
What does good look like in practice? A quarterly OGI sweep captures visuals and prioritizes work orders, continuous sensors watch compressors between rounds, and a monthly review meeting closes the loop on open leaks and aging repairs. The result is fewer surprises, faster payback, and an audit trail your compliance team can hand over confidently.
Conclusion
Leak detection and repair is more than a checkbox. It is a disciplined way to protect asset integrity, recover saleable gas, lower worker and community exposure, and meet rising ESG expectations from regulators and financiers. Teams that choose fit-for-purpose detection technology, fix the highest-emitting components first, and document repairs rigorously consistently outperform those that treat the work as a periodic chore.
If you are refreshing your fugitive emissions strategy or building a program from scratch, start with a short baseline study and a clear repair workflow, then decide where continuous monitoring raises your detection rate. To discuss a baseline study or program design, contact Osten Laboratory Limited.
